Mastering GRIBS for Weather Forecasting

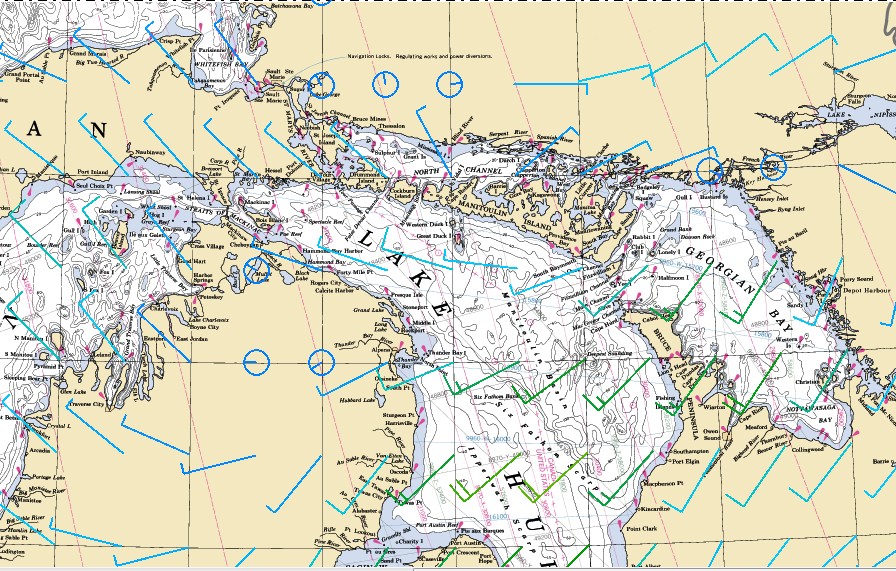
Perhaps you've already seen GRIB weather data presented in selected Sirius or XM weather outputs or various navigation software displays. GRIBs (so-named because they are visual displays created from gridded binary weather forecast data, a technical detail you don't need to worry about) illustrate wind and wave forecasts across a large area through the use of intuitively understood vectors, often coupled with the optional character displays of wind direction and strength data for any point selected on a chart. GRIB charts also allow one to examine forecasts for selected future time intervals, and often even employ visually animated displays to graphically show the progression of projected wind strength and direction over time.
In the first session of this two-session class, Chris Parker, one of the most well known and respected marine weather forecasters and routers in the business, will focus on how GRIB data can be a tremendous forecasting tool, providing more-precise forecasts than are available by any other method. Chris will also explain that there are times when GRIB data should not be used, or should be used only with great caution (it can be both precise and completely wrong!). This first session will cover some (but not all) options for accessing and displaying GRIB data efficiently.
In the second session of this series, Chris will show how he uses GRIB data in his forecasting. The bulk of this second presentation is interactive, with Chris demonstrating live how to access, view and interpret GRIB data in various GRIB viewing software packages. Part 1 is March 11, 2014 and part 2 is the following night, March 12, 2014. Both sessions are at 8:00pm EST.

